Originally for Slow-controls Dashboard. Now it can do much more.
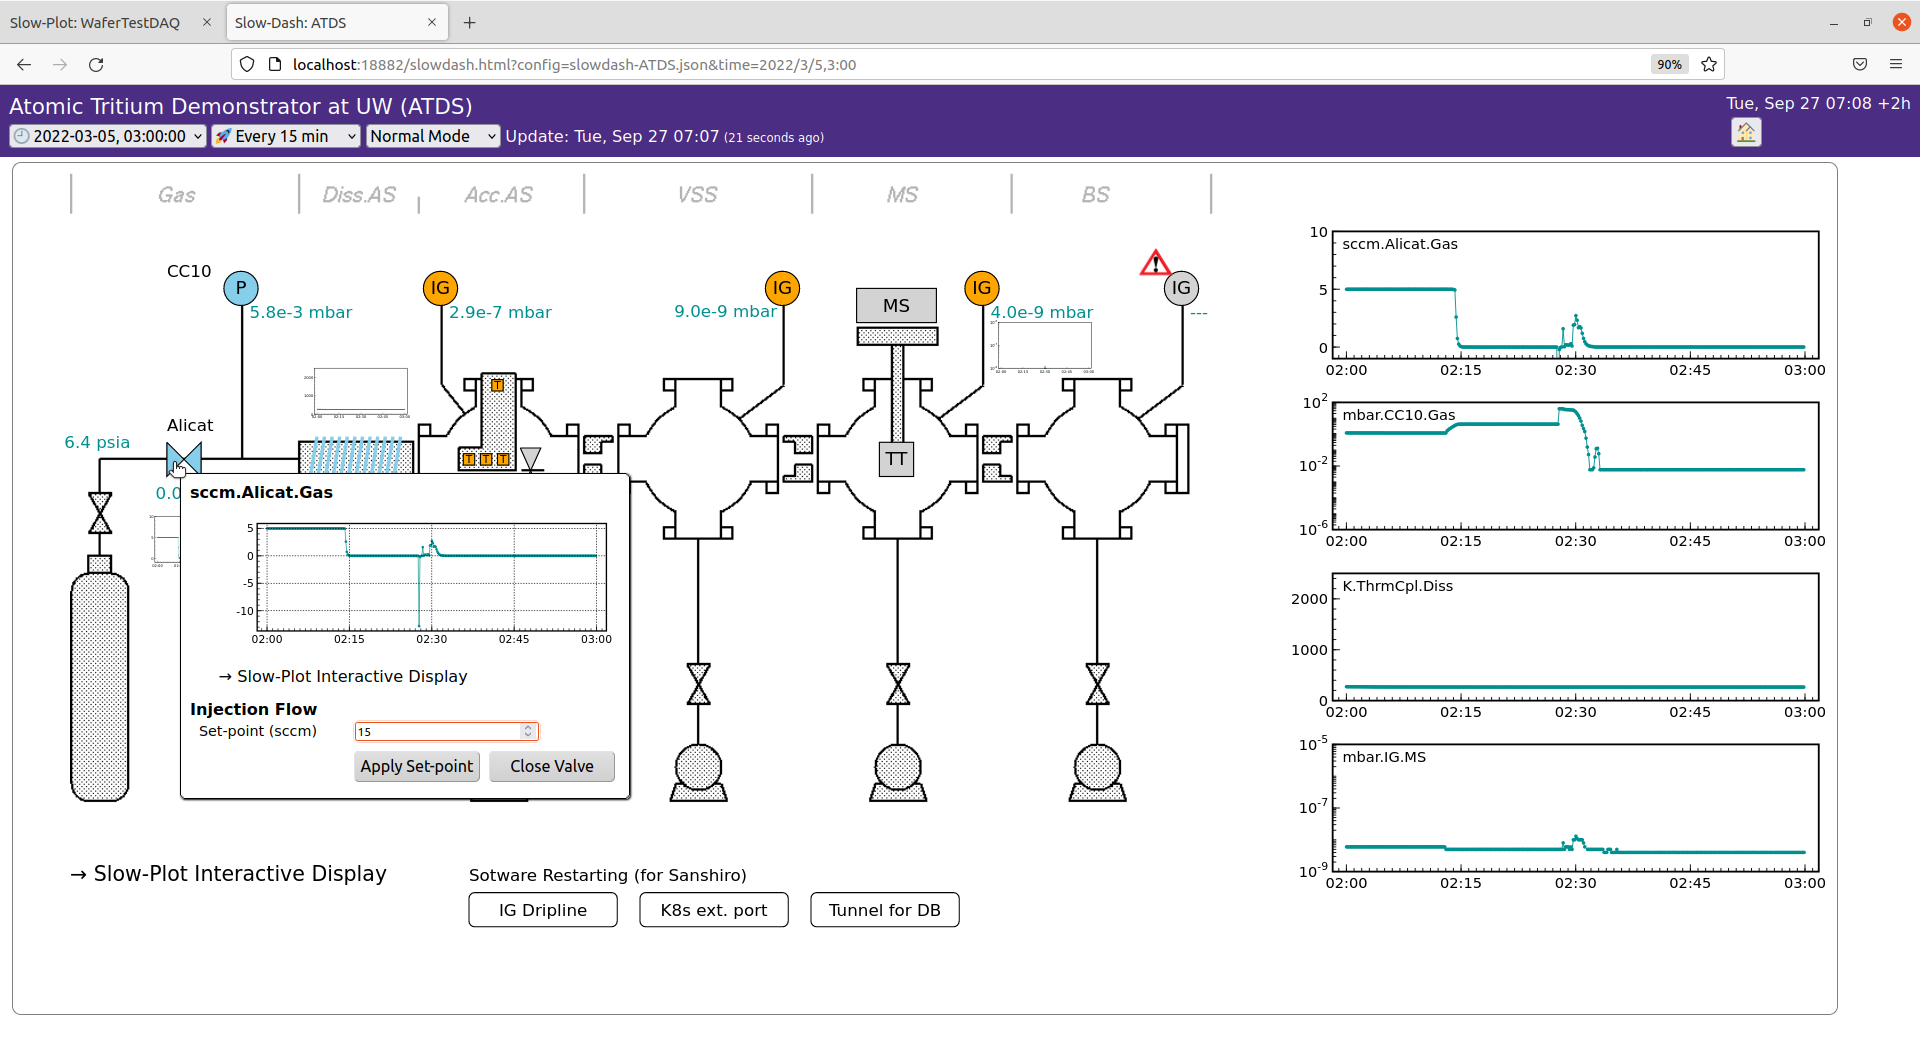 Interactive Dashboard:
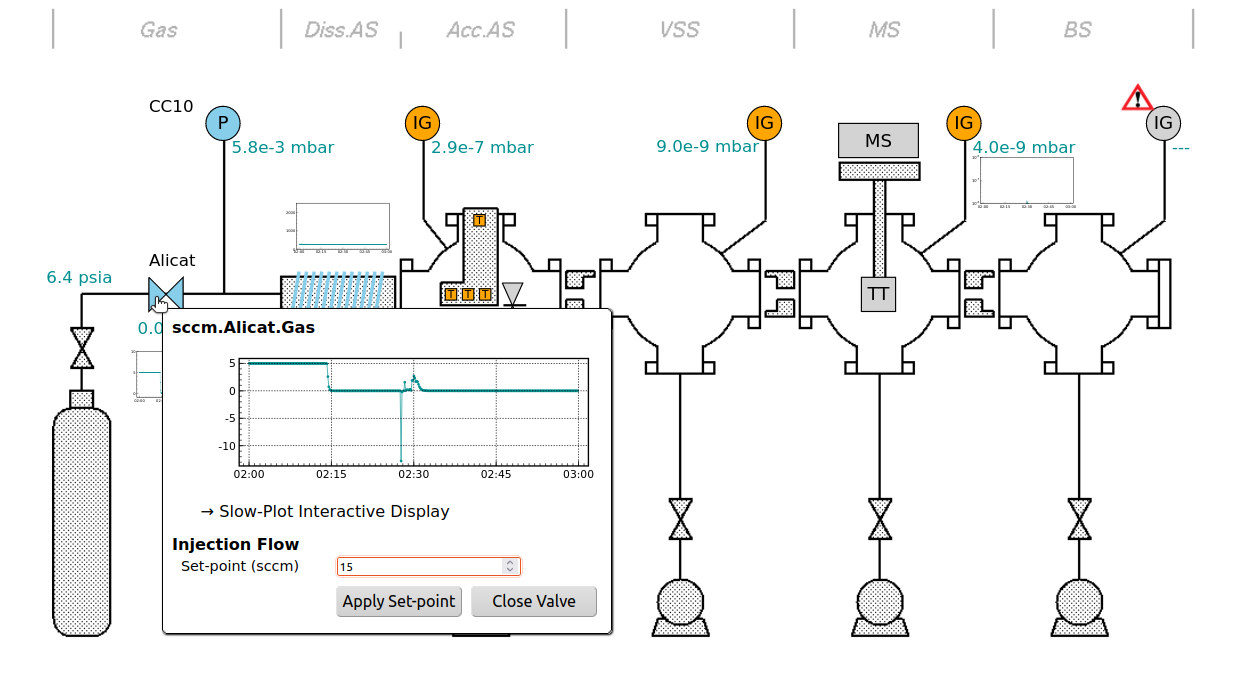
 Monitor system status through color-coded indicators, numerical displays, and historical trends. Add control interfaces as needed. Fully customizable through YAML configuration.
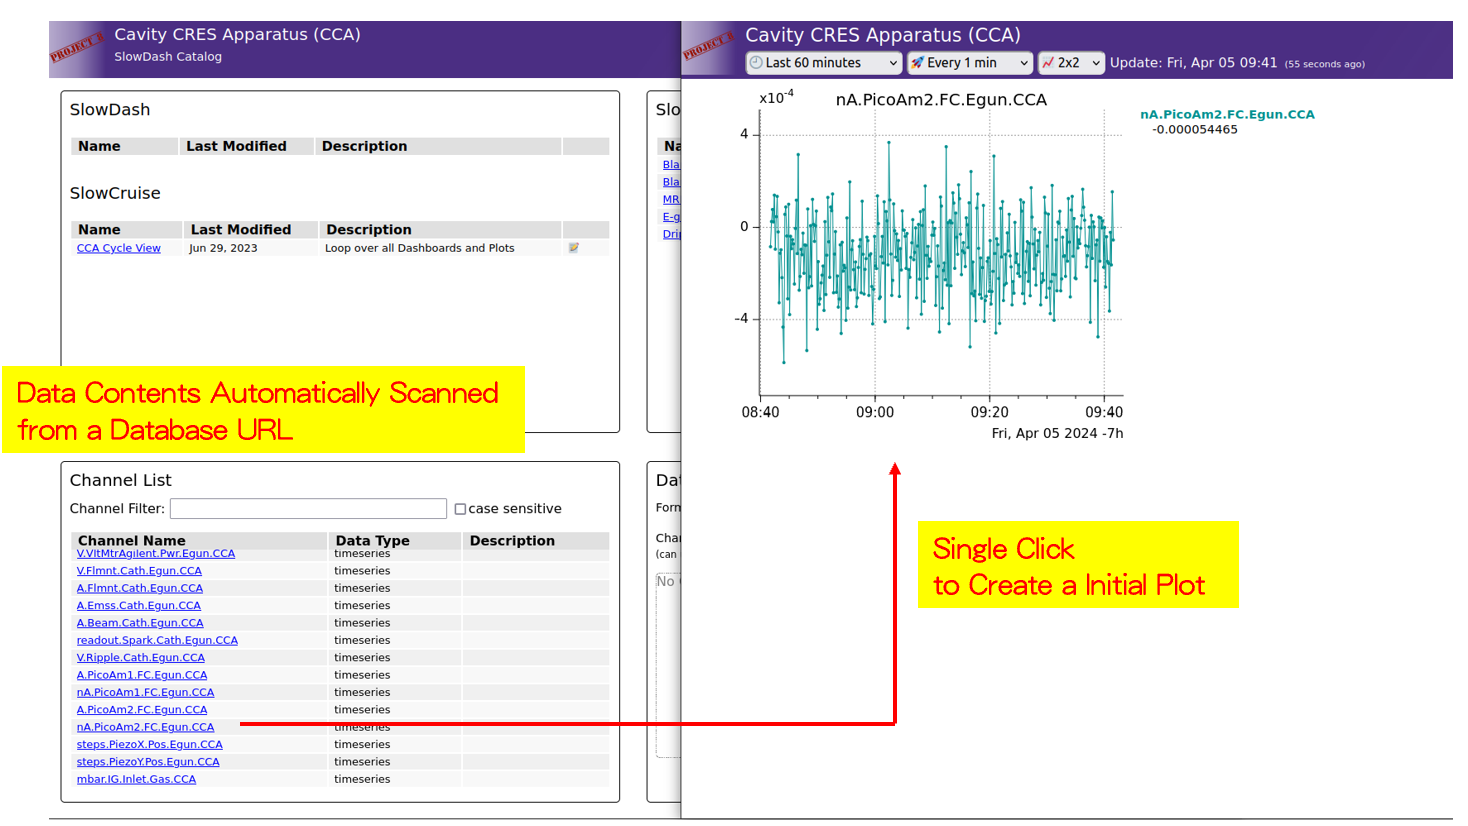
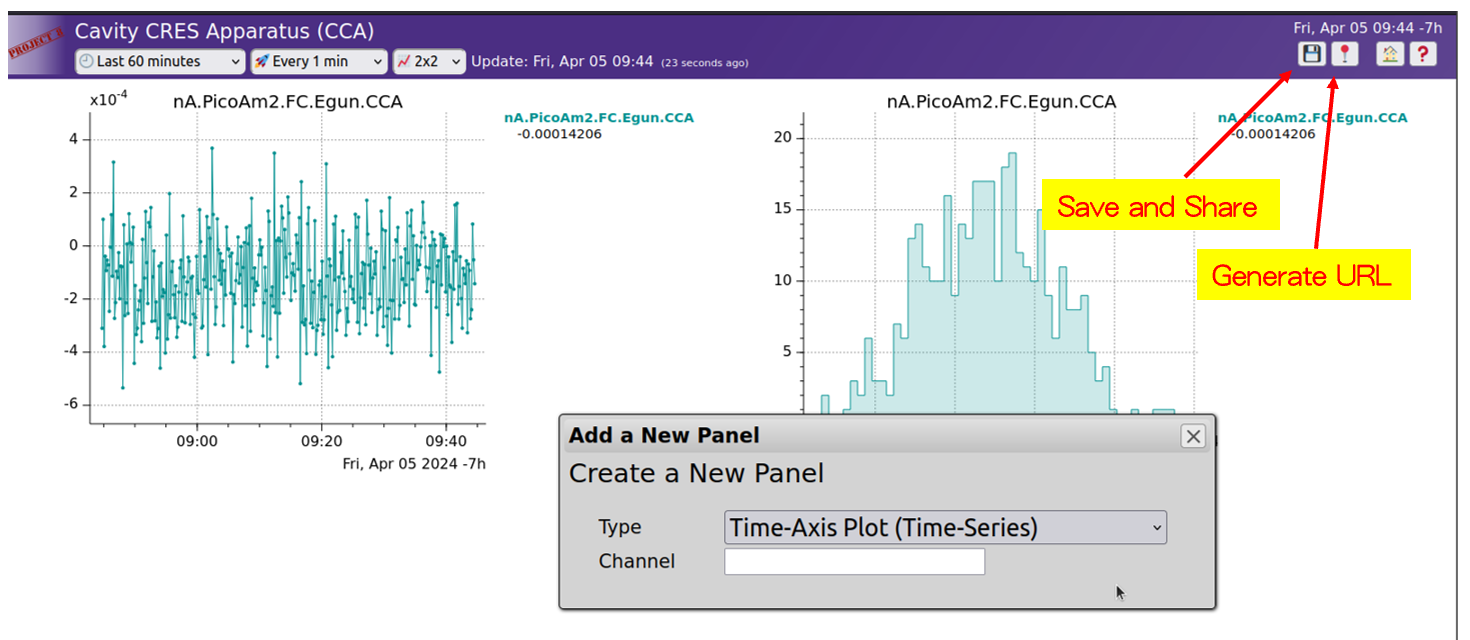
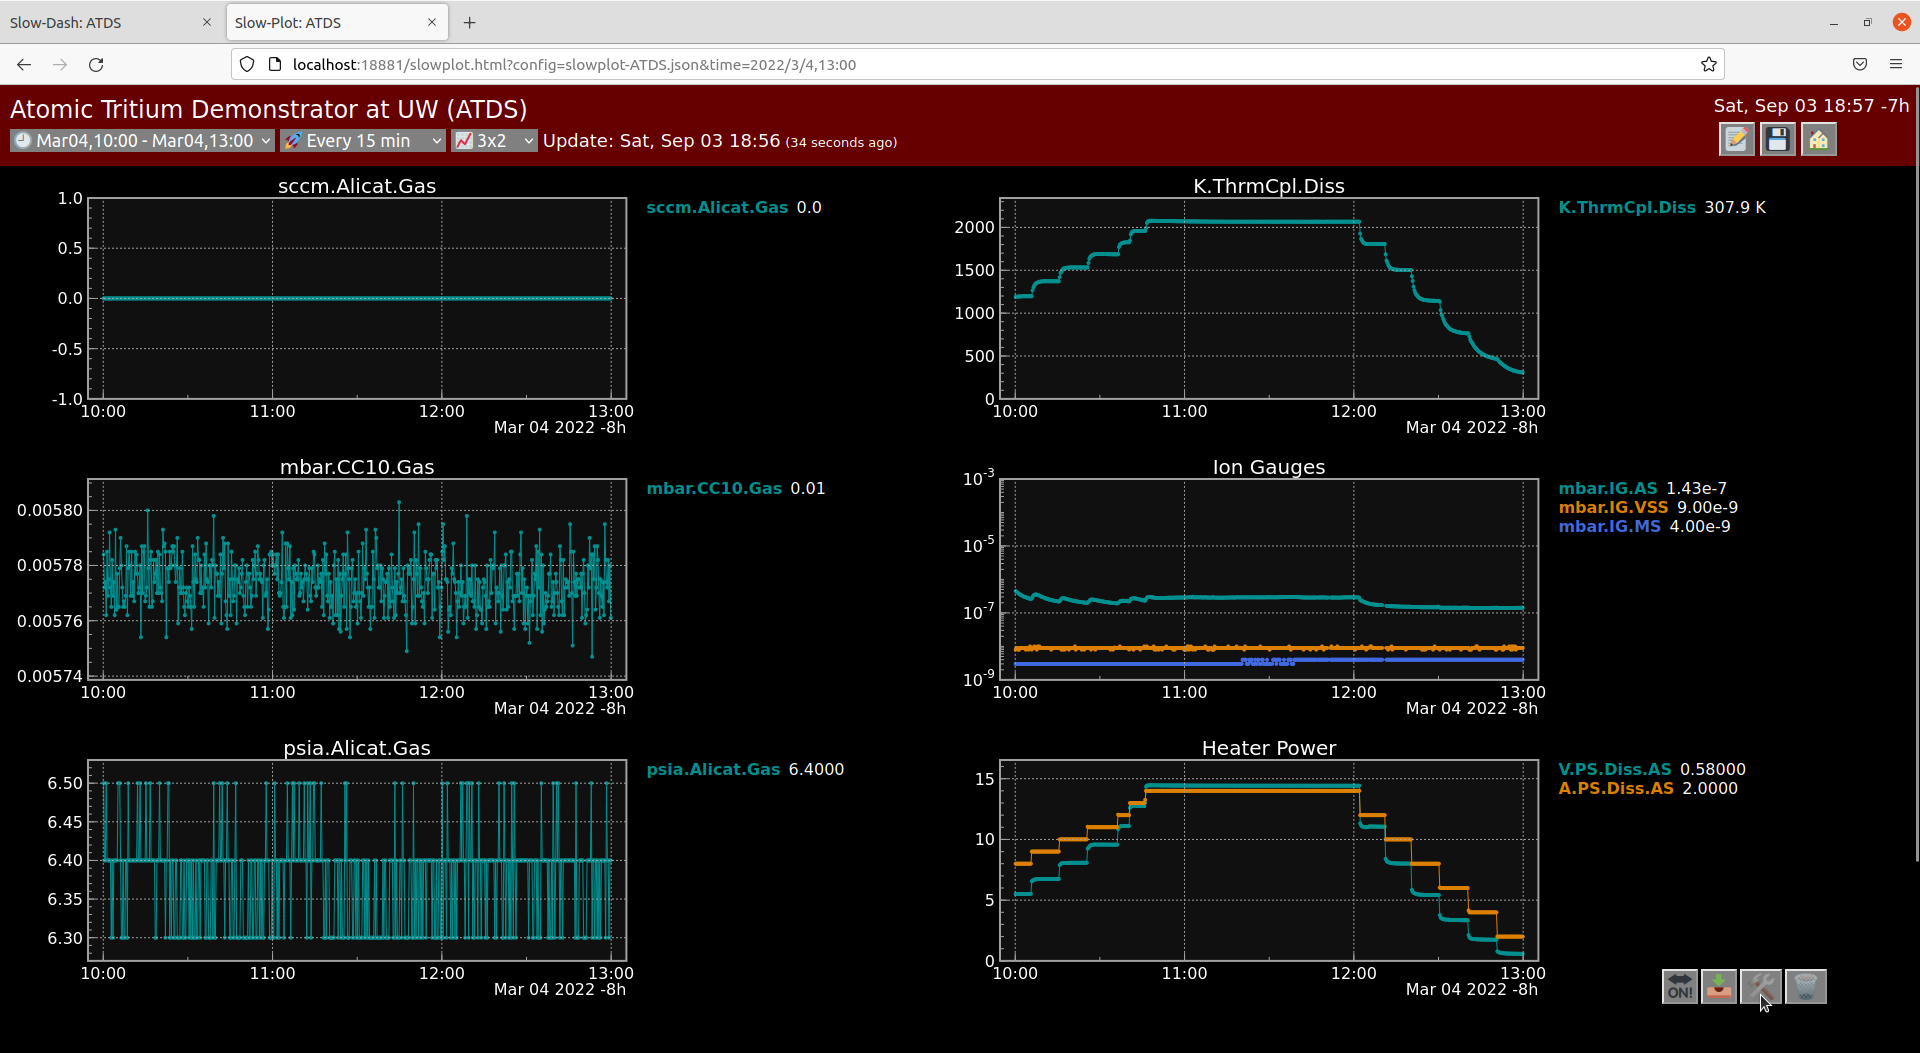 Data Visualization:
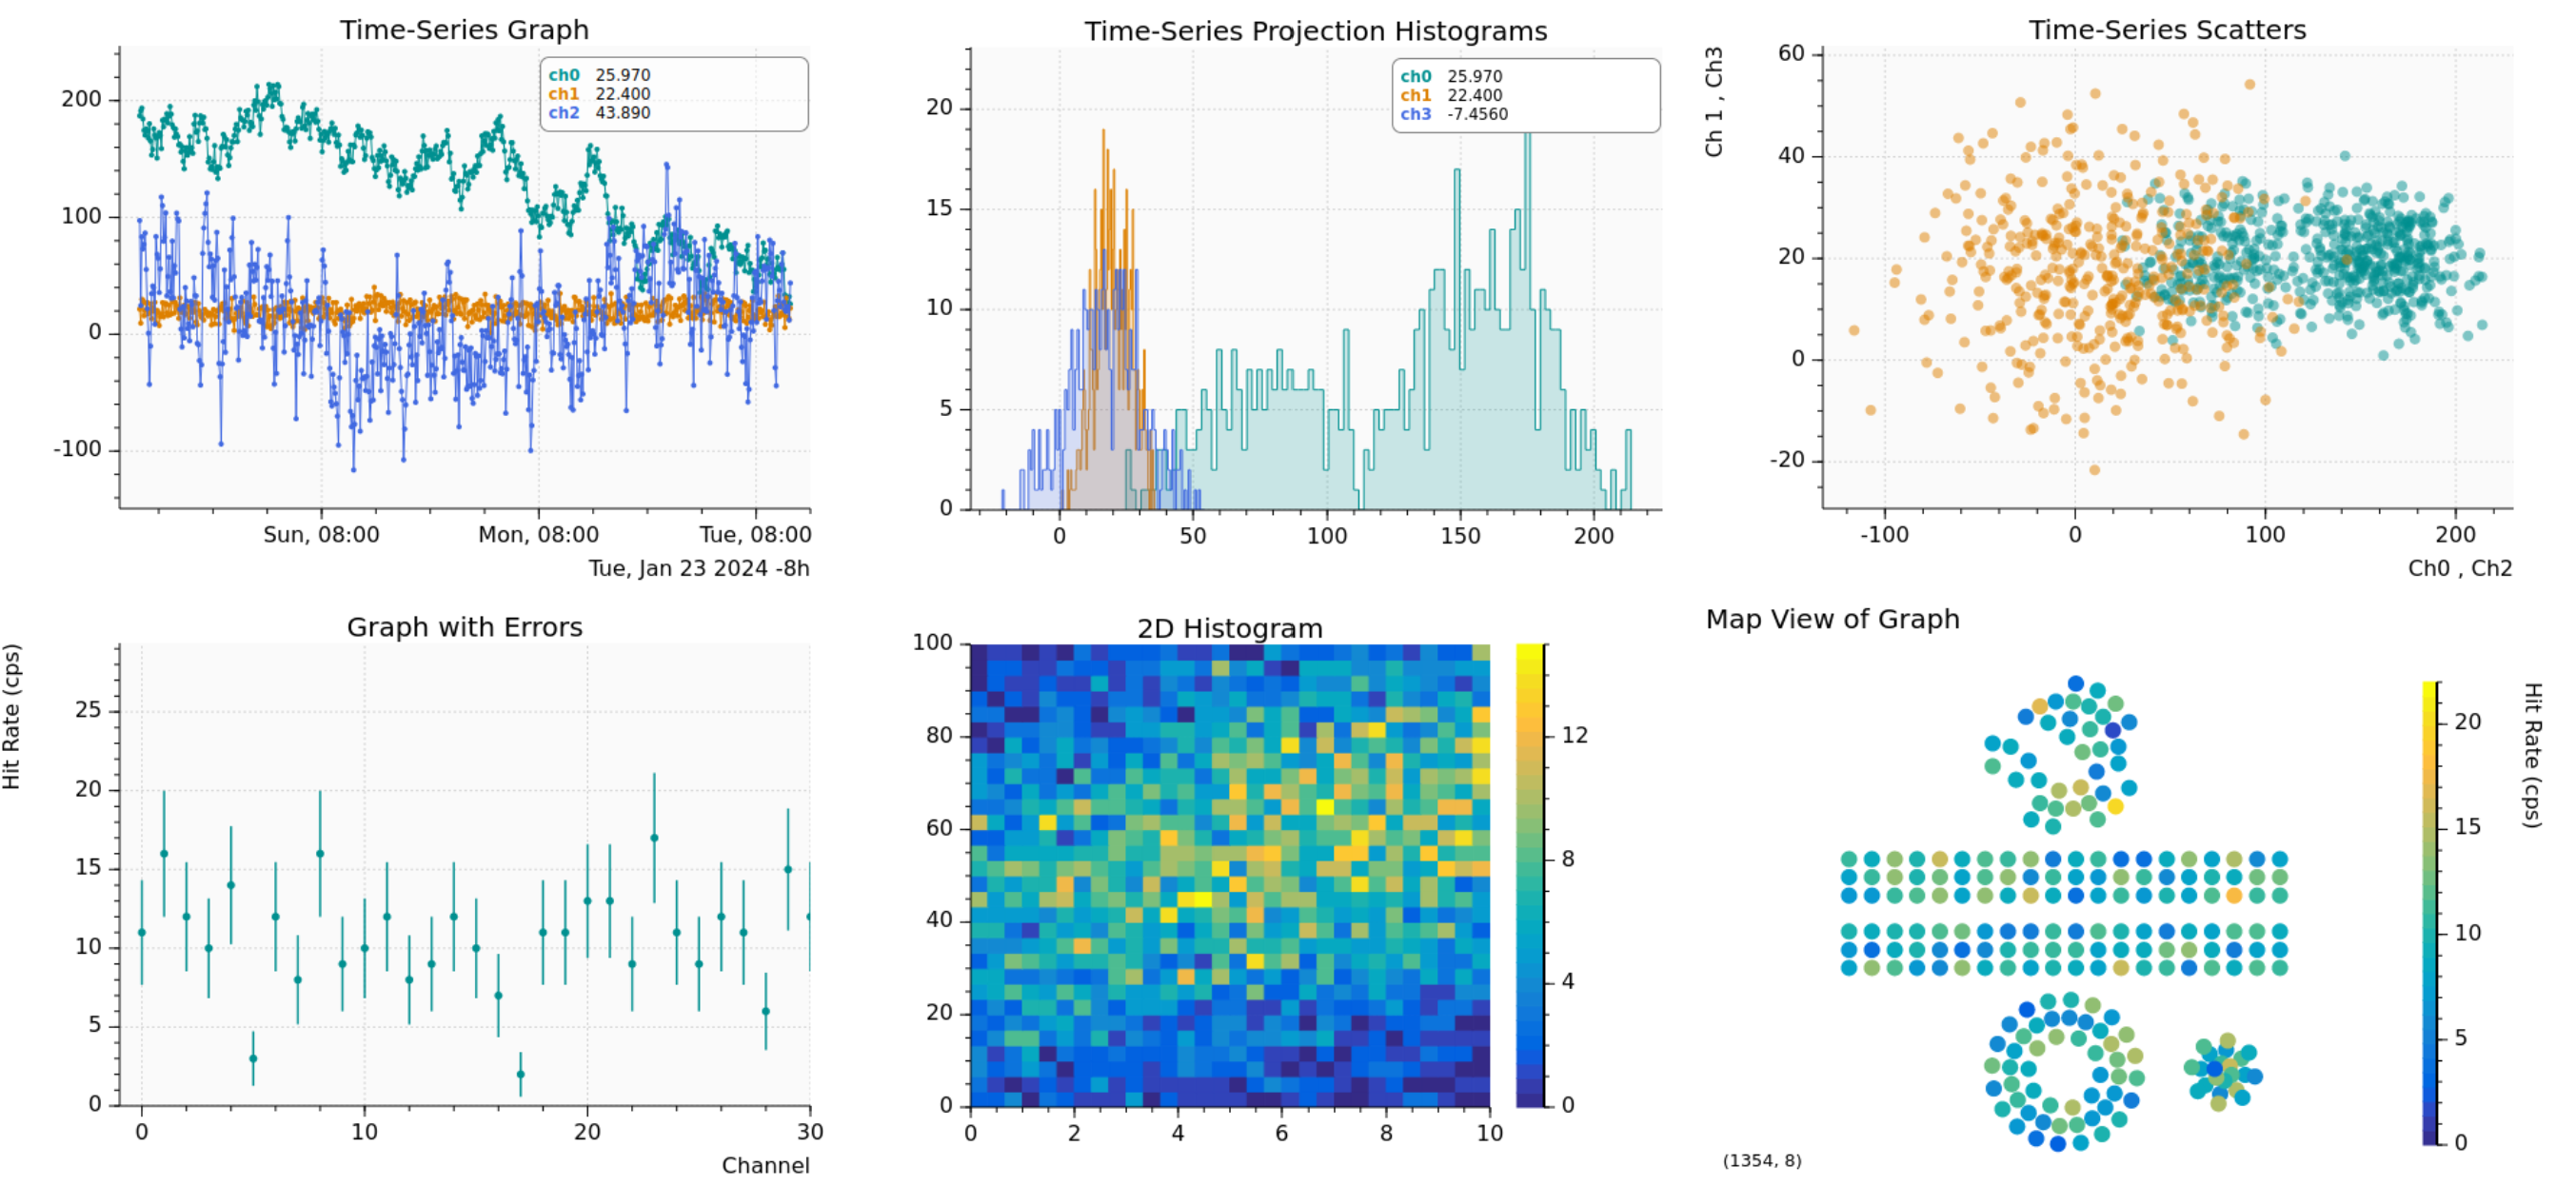
 Instantly create interactive plots from time-series data stored in various databases (SQL, InfluxDB, MongoDB, etc.) with an intuitive point-and-click interface. Example of a dark theme plot.
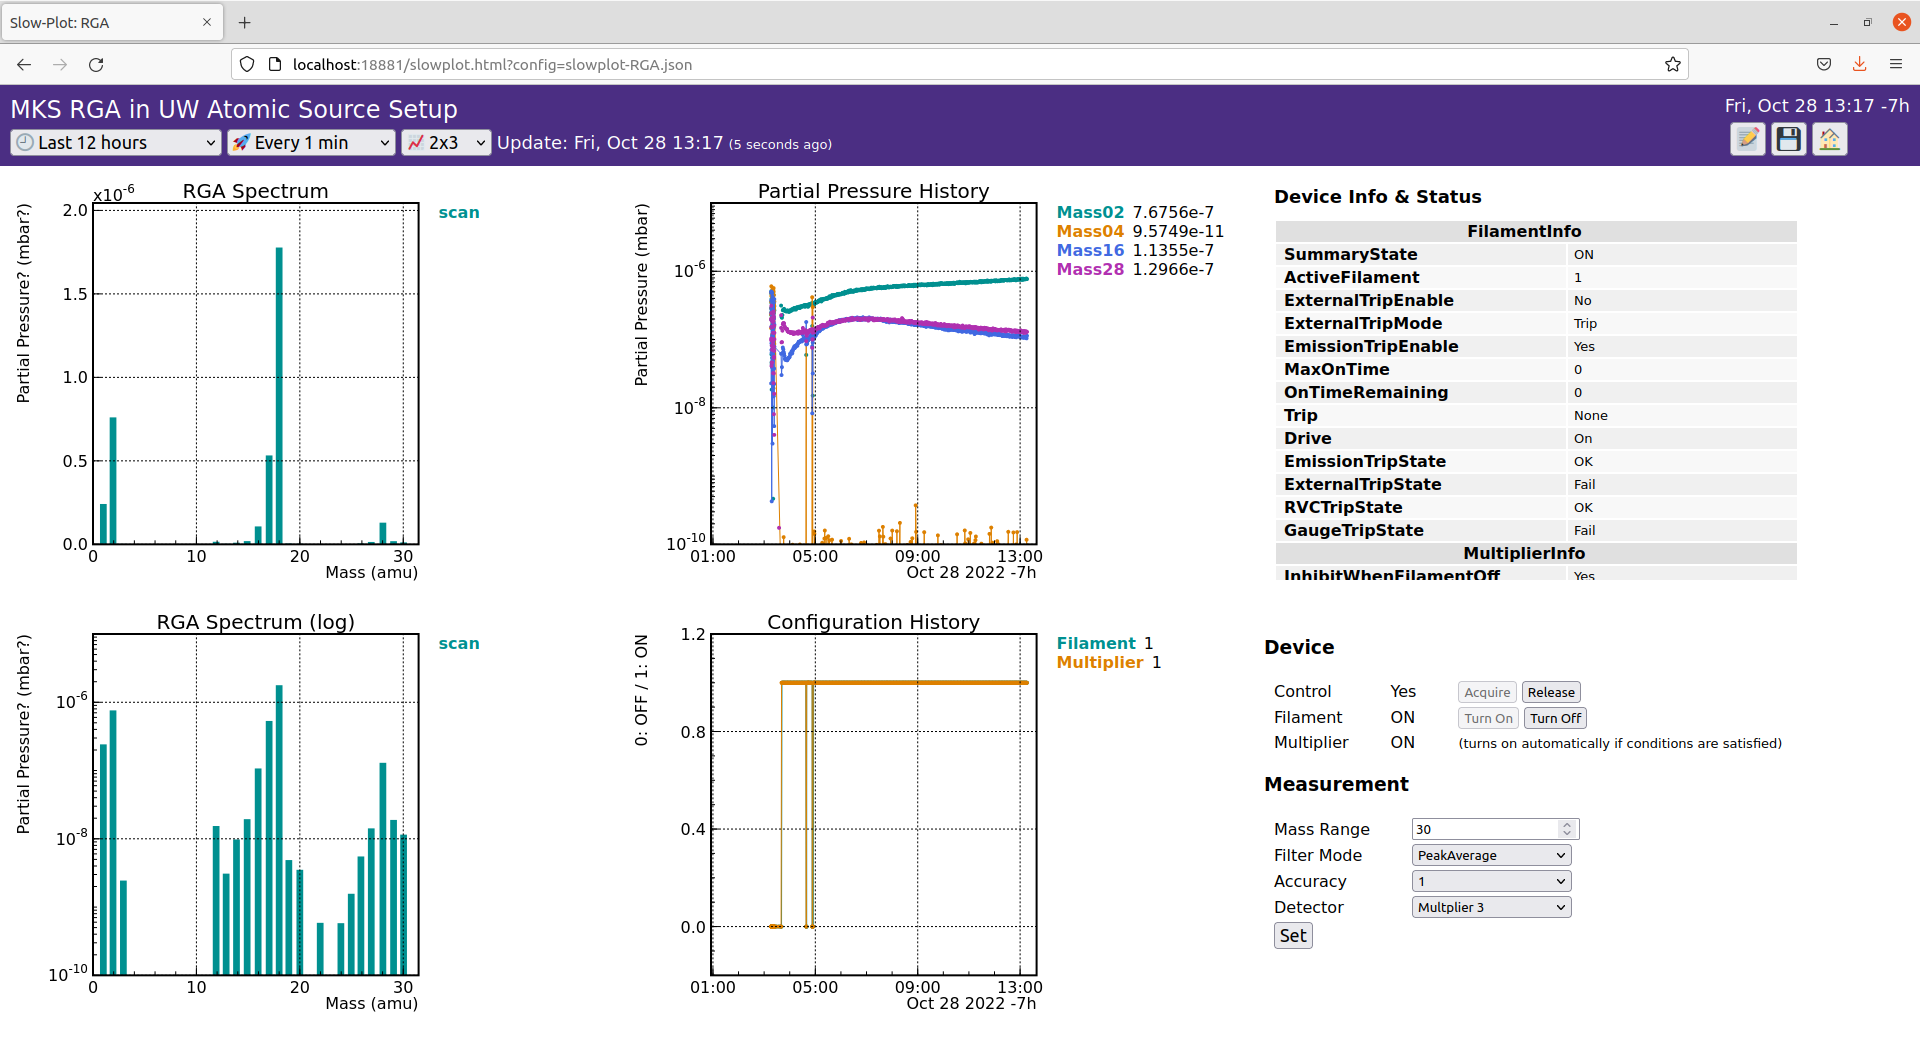 Device Integration:
 Example of a custom Python module for RGA control. Operations are seamlessly handled between the UI and hardware through user Python modules, with spectrum data stored in CouchDB.
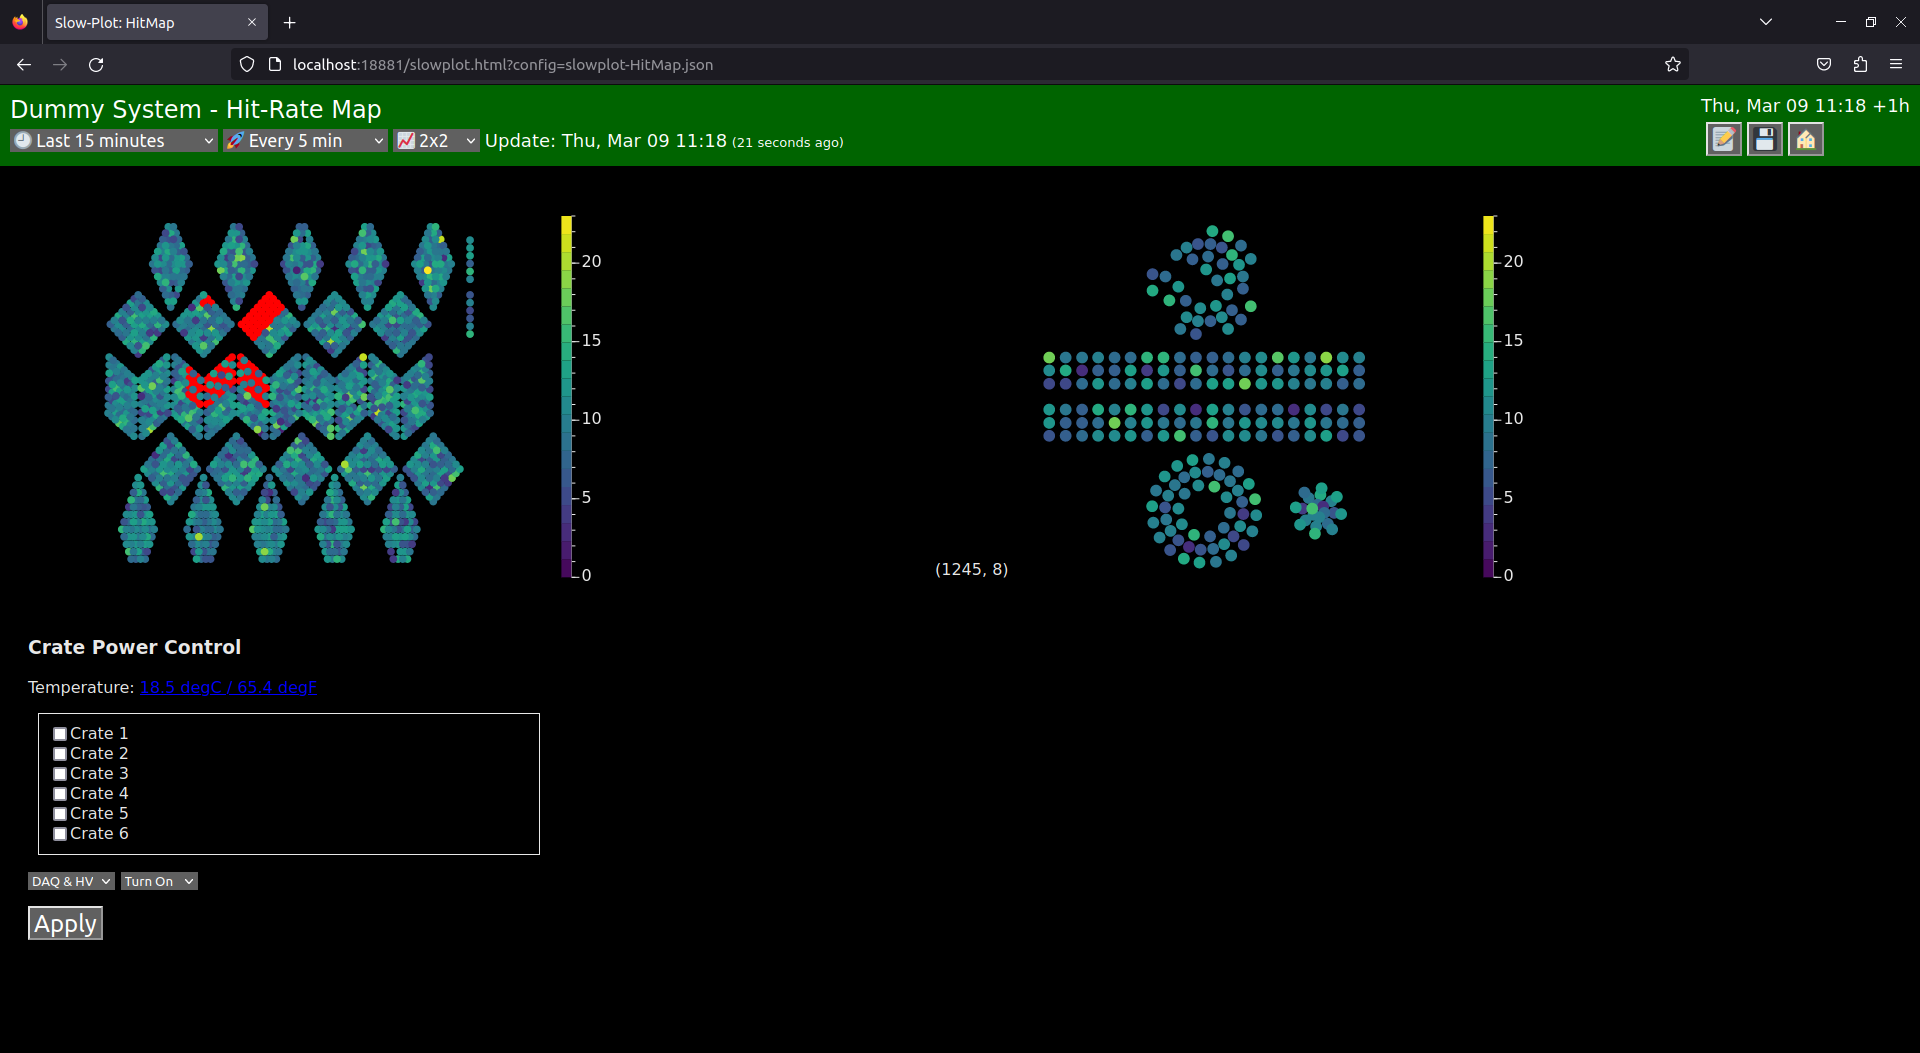 Interactive Map Views:
 Visualize graph data in schematic layouts. Define elements using simple CSV coordinates (x,y,r) or create complex layouts with SVG files and mapping keys for maximum flexibility.
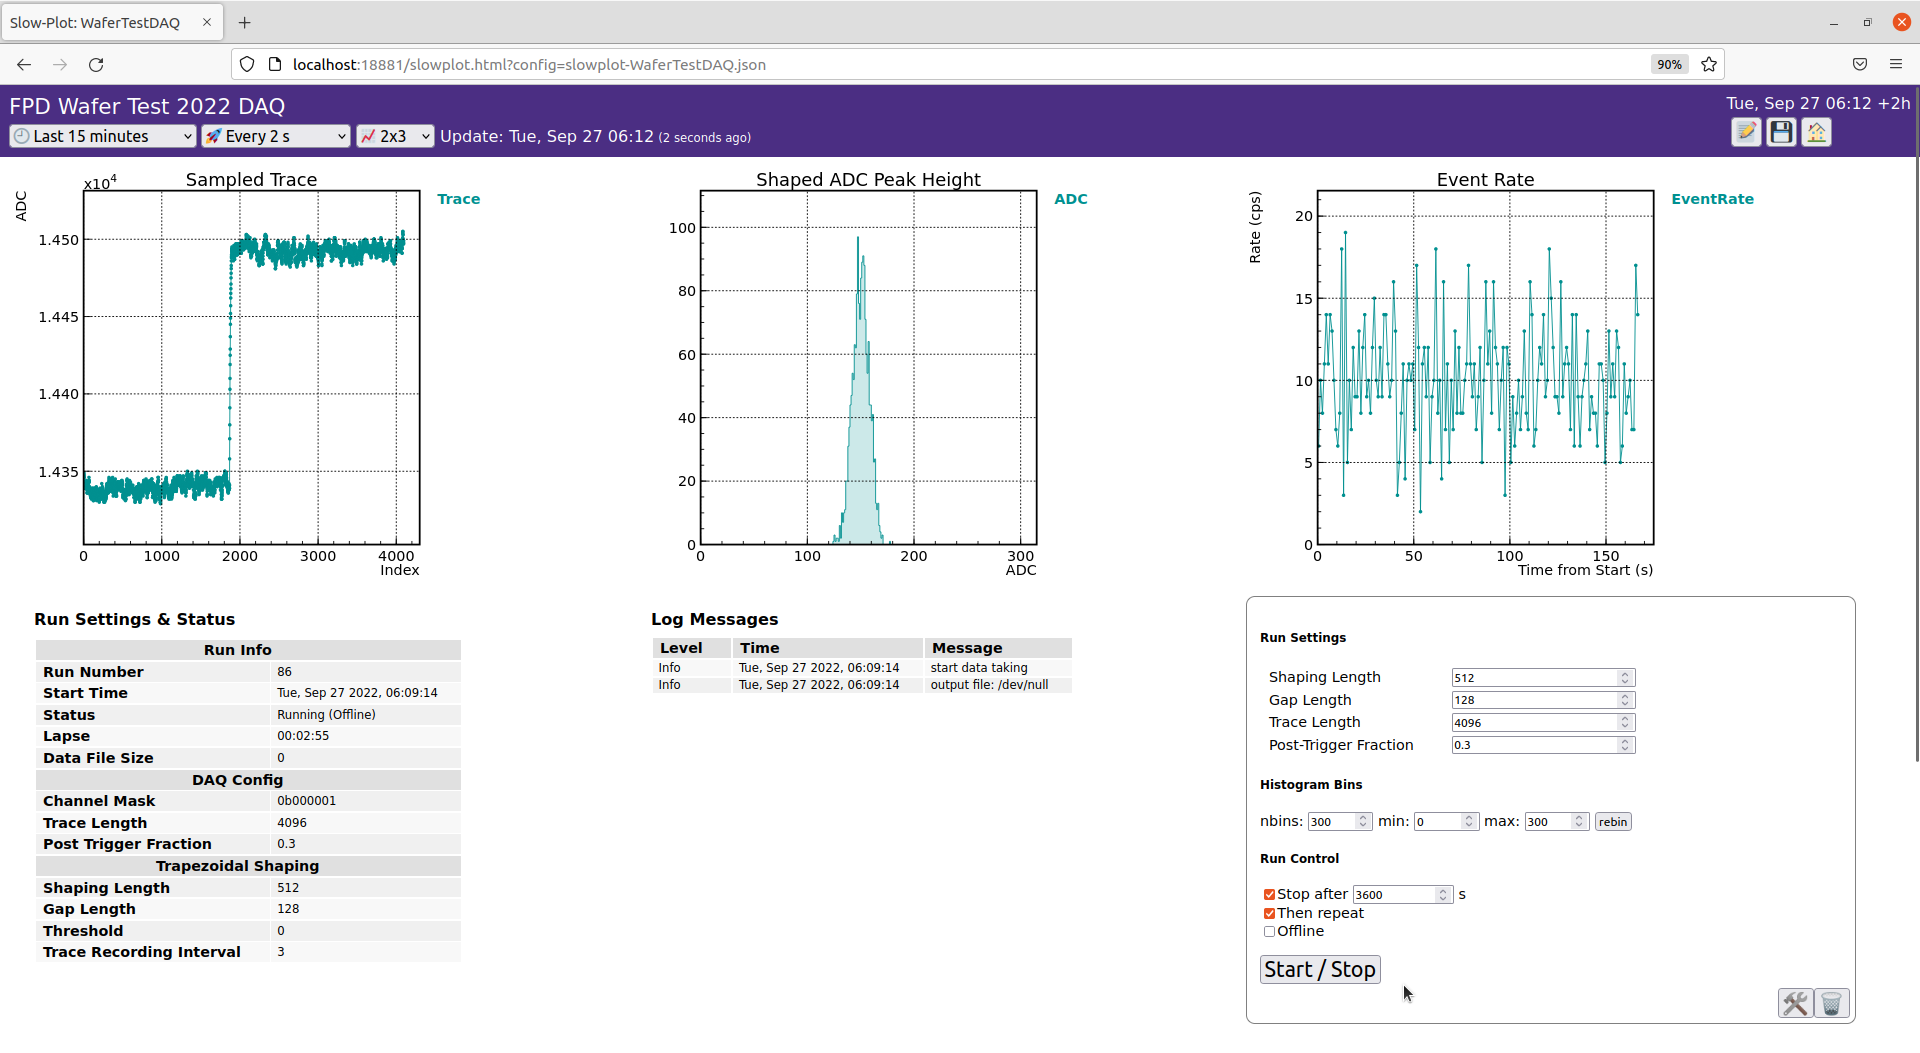 Real-time Data Acquisition:
 Example of a waveform digitizer readout. Interface with DAQ systems through custom Python modules. Manage run controls, configuration, and monitoring while visualizing streaming data (histograms, etc.) via Redis.
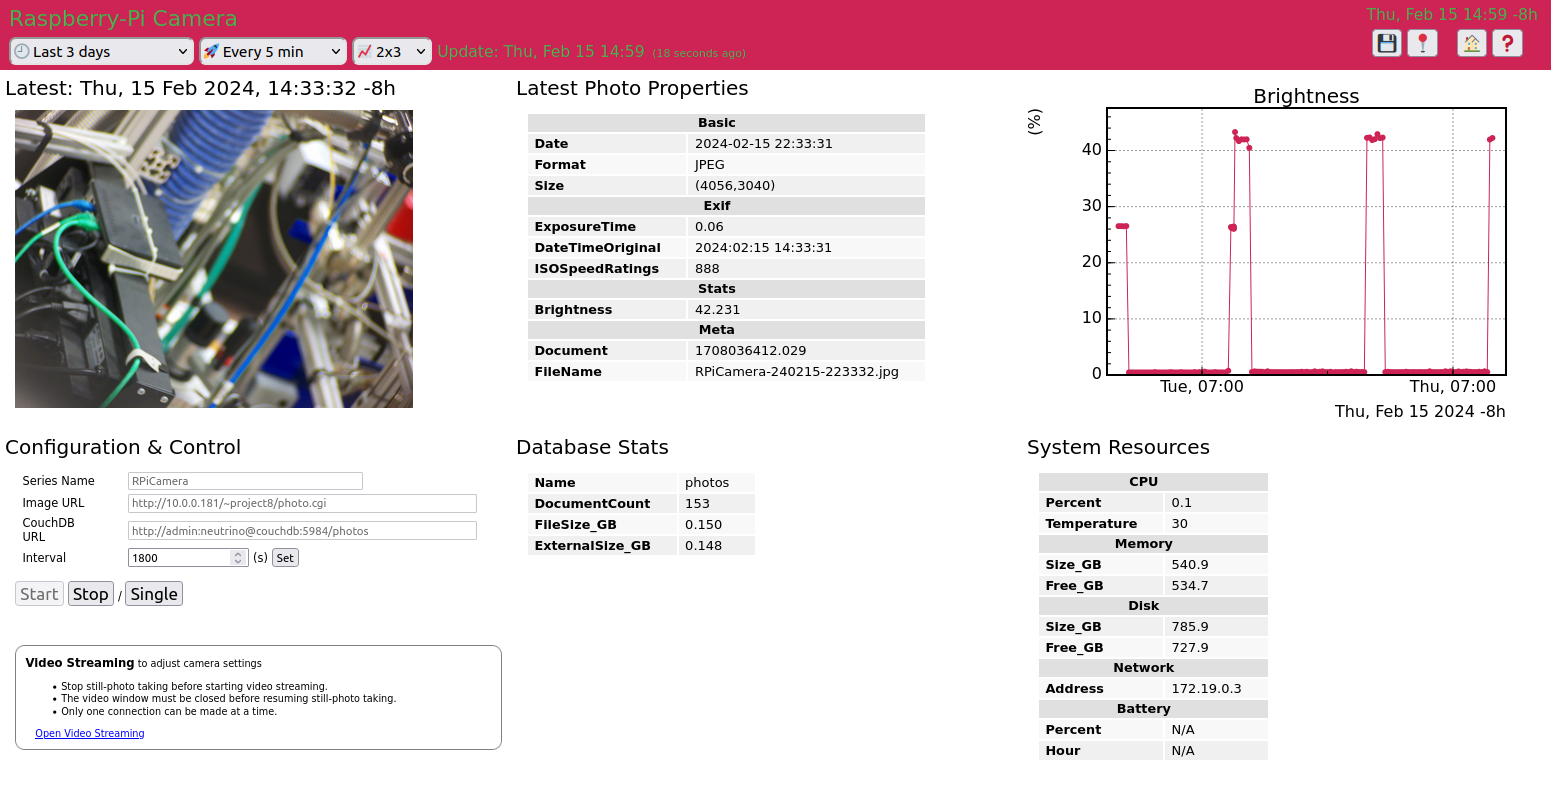 Media Management:
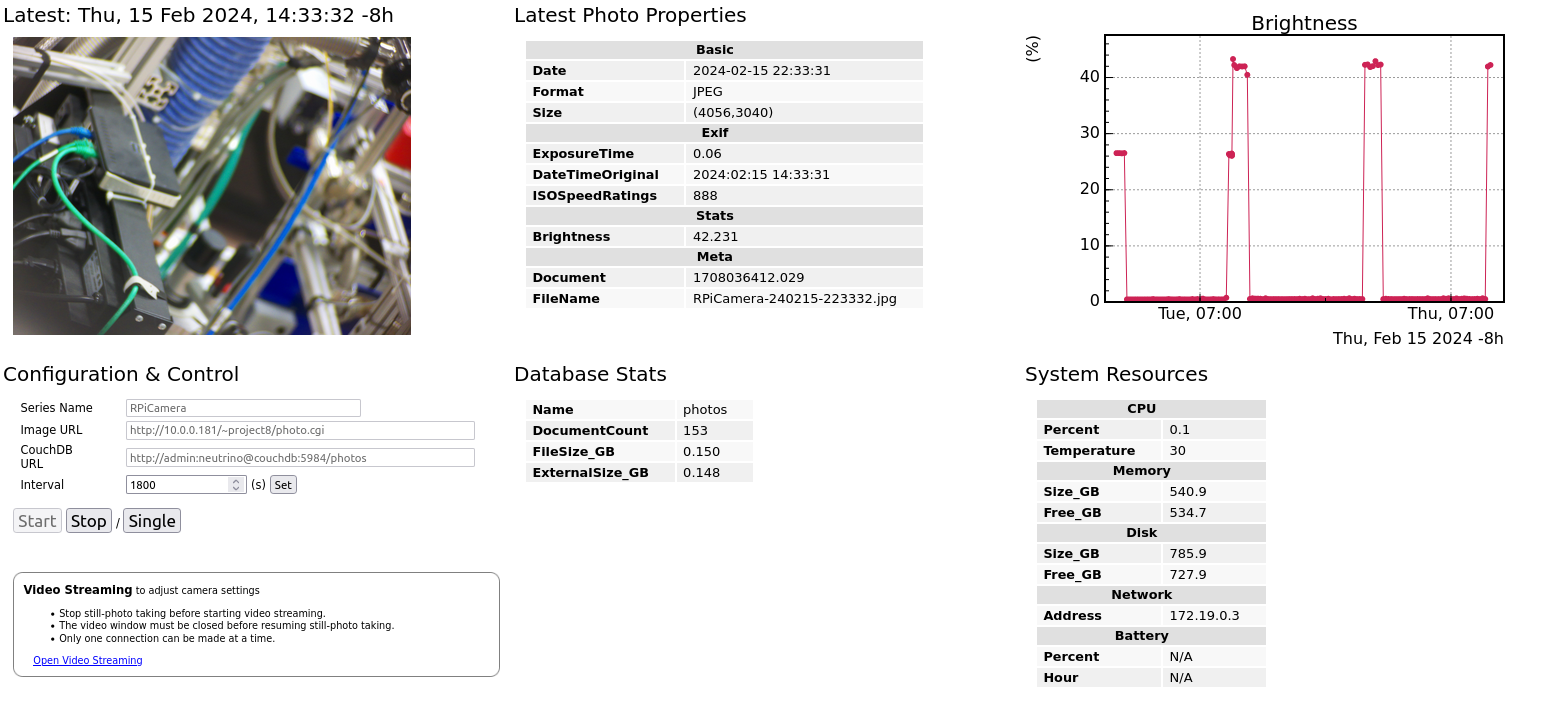
 Example of a Raspberry-Pi Camera system. Implement automated image capture and storage with a lightweight Python module. Browse time-series photo collections stored in CouchDB as blob data.