PROJECT/config, and the name
must be slowdash-NAME.json.Projects/ATDS/Config:{
"meta": {
"name": "ATDS",
"title": "",
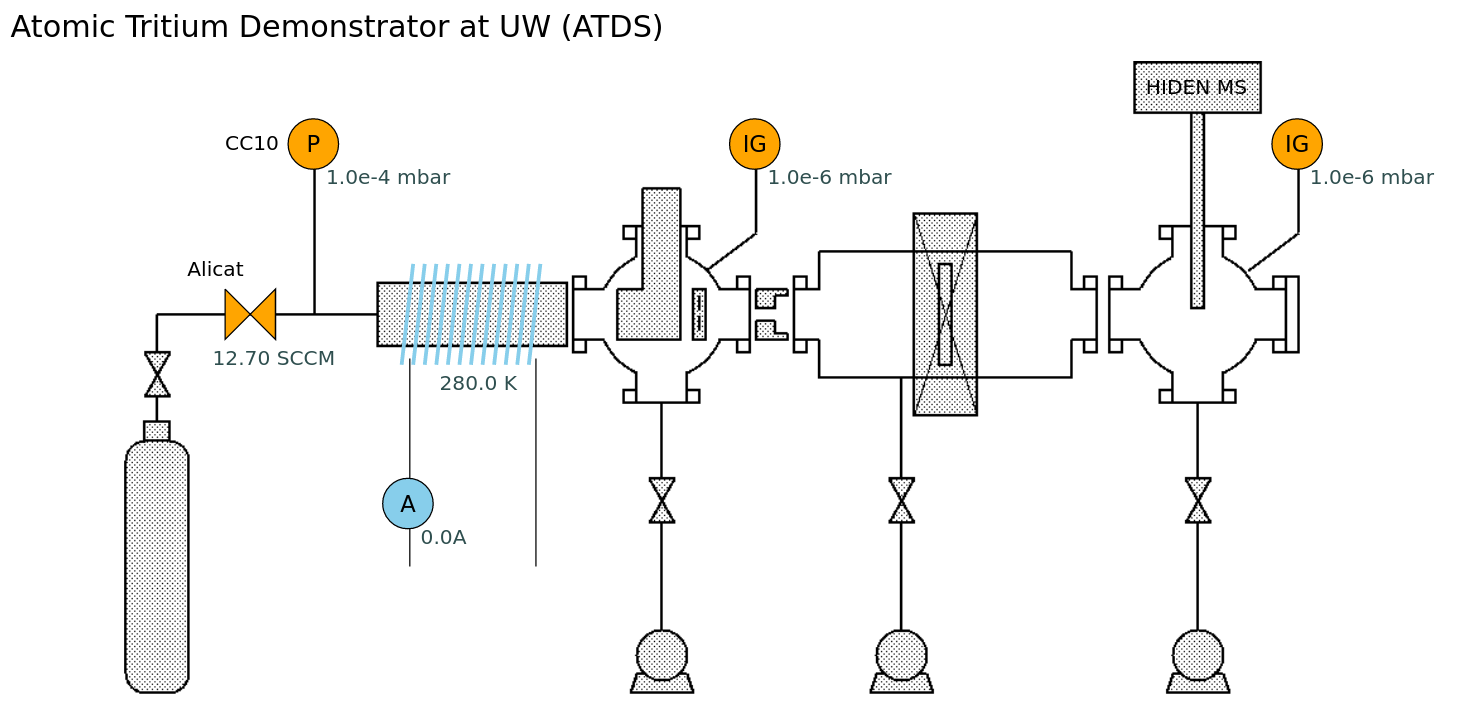
"description": "Atomic Tritium Demonstrator at UW Top Level"
},
"view_box": "0 -10 1600 700",
"items": [
{
"type": "image",
"attr": { "x": 50, "y": -2, "height": 554, "width": 1003, "href": "ATDS.png" }
},
{"_type": "grid"},
{
"type": "valve",
"attr": {
"x": 135, "y": 235, "width": 30, "height": 30, "orientation": "horizontal",
"data-dx": -10, "data-dy": 50
},
"metric": { "channel": "sccm.Alicat.Gas", "active-above": 0.1, "format": "%.1f sccm" },
"action": { "form": "AlicatFlow" }
},
{
"type": "circle",
"attr": { "x": 185, "y": 85, "width": 30, "height": 30, "label": "P" },
"metric": { "channel": "mbar.CC10.Gas", "active-below": 1, "format": "%.1e mbar" }
},
...
],
"forms": {
"AlicatFlow": {
...
}
}meta for meta information of this configuration
file.view_box defines the coordinate for item
placement.items is a list of items.forms is for a mini control panel to send commands to
server-side scripts (typically to control the device).x, y, width,
height: position and size of the item on the canvasstroke, fill: line color and fill
colorlabel: text drawn in the shapelabel-dx, label-dy: offset position of the
label textlabel-font-family, label-font-size: label
fontdata-dx, data-dy: offset position of the
data value indicatordata-font-family, data-font-size: data
indicator fontdata-color: data indicator color{
"metric": { "channel": "mbar.CC10.Gas", "active-below": 1, "format": "%.1e mbar" },
...
}active-above and/or active-below defines
the active range. The color of the item changes accordingly.format is used for data indicator text.tolerable-gap can be specified for the gap in
time-series before the alarm icon is shown. The default is 60 sec.{
"action": { "open": "./slowplot.html?config=slowplot-ATDS.json" },
...
}{
"action": { "submit": { "action": "restart_IG" } },
...
}{
"action": { "form": "AlicatFlow" },
...
}Forms are defined separately in the same configuration file:
{
    "forms": {
        "AlicatFlow": {
            "title": " Injection Flow",
            "initial": {},
            "inputs": [
                { "name": "flow", "label": "Set-point (sccm)", "type": "number", "step": 0.1 "initial": 15 }
            ],
            "buttons": [
                { "name": "apply", "label": "Apply Set-point" },
                { "name": "close", "label": "Close Valve" }
            ]
        },
        ...
    },
    ...
}
The configuration above creates a form like this (bottom part of the panel):
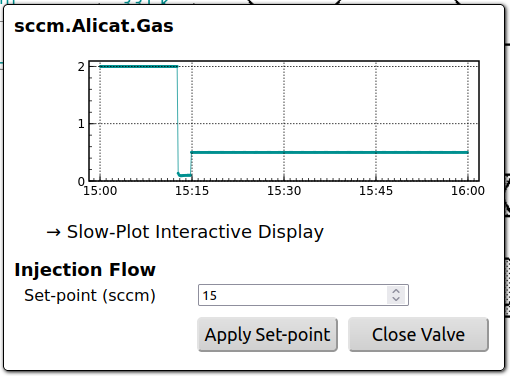
image{
"href": null,
"x": null, "y": null, "height": null, "width": null
}width and height, using the same
aspect ratio as the image file will prevent stretching.x and y (and possibly
width and height) to place the base image for
a convenient alignment.gridtype: grid to _type: grid to
disable the grid once item placement is completed.{
"view_box": "0 -10 1600 700",
"items": [
{
"type": "image",
"attr": { "x": 50, "y": -2, "width": 1003, "height": 553, "href": "ATDS.png" }
},
{"type": "grid"},
]
}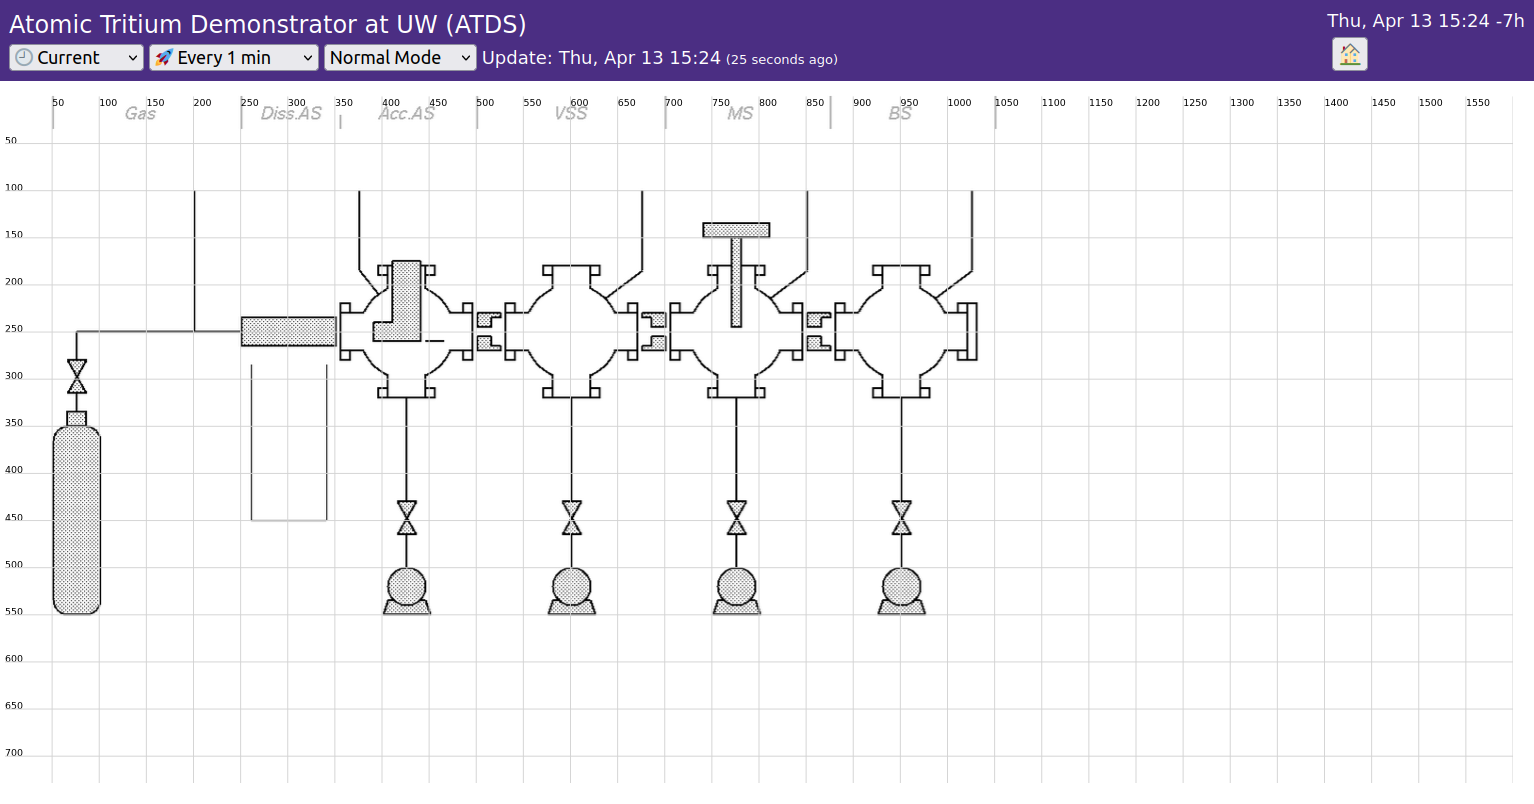
width and
height attributes are set to match the image dimensions.
Changing these values will scale the image.x and y attributes are adjusted to
align the image component nicely on the grid.view_box defines the overall coordinate, in
(xmin, ymin, xmax, ymax). Non-zero min values are often useful to adjust
the margin.metric binding create static
shapes.metric binding will have:
fill colors based on data values."metric": {"format": ...}Attributes common among Shape Items and the default values are:
{
    "x": null, "y": null, "height": null, "width": null,
    "label": null,
    "stroke": this.style.strokeColor,
    "fill": "none",
    "data-dx": null, "data-dy": null,
    "label-dx": null, "label-dy": null,
    "data-color": this.style.dataColor,
    "data-font-family": this.style.dataFontFamily,
    "data-font-weight": this.style.dataFontWeight,
    "data-font-size": this.style.dataFontSize,
    "data-dominant-baseline": undefined,
    "data-text-anchor": undefined,
    "label-font-family": this.style.labelFontFamily,
    "label-font-weight": this.style.labelFontWeight,
    "label-font-size": this.style.labelFontSize,
    "label-dominant-baseline": "central",
    "label-text-anchor": "middle",
}boxmandatory attributes and default values are:
{ "x": null, "y": null, "width": 30, "height": 30 }circleMandatory attributes and default values are:
{ "x": null, "y": null, "width": 30, "height": 30 }valveMandatory attributes and default values are:
{ "x": null, "y": null, "width": 30, "height": 30, "orientation": "horizontal" }solenoidMandatory attributes and default values are:
{ "x": null, "y": null, "width": 50, "height": 30, "fill": "none", "stroke-width": 3, "turns": 12 }invisible
x and y attributes are still necessary
to draw the data labels.Mandatory attributes and default values are:
{ "x": null, "y": null }text
"action": {"open": URL} creates a
hyperlink.metric shows only the data values. (The
text attribute will have no effect.)Mandatory attributes and default values are:
{
    "x": null, "y": null, "text": "",
    "font-family": this.style.fontFamily,
    "font-weight": this.style.fontWeight,
    "font-size": this.style.fontSize,
    "fill": this.style.strokeColor,
    "data-color": this.style.dataColor
}plot
action.Mandatory attributes and default values are:
{
    "x": null, "y": null, "width": 120, "height": 30,
    "rx": 5, "ry": 5,
    "label": "",
} plot / micro_plot
metric to assign a channel.Mandatory attributes and default values for a plot
are:
{
    "x": 0, "y": 0, "width": 100, "height": 100, "zoom": 0.8,
    "length": 3600, "dateFormat": null, "label": null,
    "ticksX": 5, "ticksY": 2, "grid": true,
    "min": null, "max": null, "logY": false,
    "marginTop": 0,
    "data-color": this.style.dataColor,
    "fill-opacity": 0, "fill-baseline": 1e-100,
    "timerange-margin-percent": 3,
}
micro_plot is a small box showing a data history plot
without axis labels. This is basically the same as plot,
with some different default values:
{
     "width": 50, "height": 30, "zoom": 0.2,
     "marker-opacity": 0, "fill-opacity": 0.3,
     "ticksX": 0, "ticksY": 0,
     "marginTop": 0, "marginBotton": 0, "marginLeft": 0, "marginRight": 0,
     "label": ""
    "timerange-margin-percent": 0,
}(x,y).x is used for the index of elements,
and y is used for color.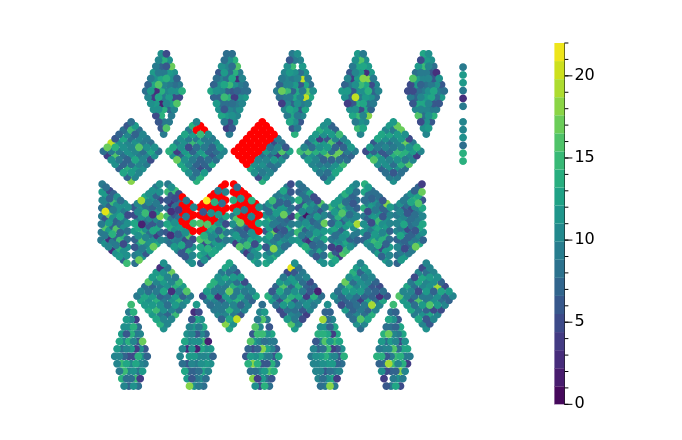
index fields define binding to the x
values of the data object (graph or histogram).Example 1:
{
  "width": 1.0,
  "height": 1.0,
  "items": [
    {"index":1200,"shape":"circle","attr":{"cx":0.370000,"cy":0.822000,"r":0.015}},
    {"index":1201,"shape":"circle","attr":{"cx":0.403000,"cy":0.814000,"r":0.015}},
    {"index":1202,"shape":"circle","attr":{"cx":0.367000,"cy":0.780000,"r":0.015}},
    {"index":1203,"shape":"circle","attr":{"cx":0.400000,"cy":0.783000,"r":0.015}},
    ...
  ]
}
Example 2:
{
    "width": 1.000,
    "height": 1.000,
    "items": [
        {
            "index": 0,
            "shape": "path",
            "attr": {
                "d": "M0.500,0.500 L0.580,0.500 A0.080,0.080 0 0,0 0.500,0.420 z"
            }
        },
        {
            "index": 1,
            "shape": "path",
            "attr": {
                "d": "M0.500,0.500 L0.500,0.420 A0.080,0.080 0 0,0 0.420,0.500 z"
            }
        },
    ...
  ]
}utils/xy2map.py can be used to create a JSON map file from
a CSV of index, x, y.index,x,y
24,0.485,0.915
25,0.461,0.915
26,0.449,0.915
...$ PATH/TO/SLOWDASH/xy2map.py NAME.csv > map-NAME.jsonwidth and height are both 1.0.radius is 0.01.--svg option a SVG image file will be
also created, which is convenient to test the map file.<form>
to send commands to the server-side user script.Current property is set, the panel
contents are displayed only when the display time range includes
“now”.div.innerHTML = ... with parameter substitutions.<h3>Crate Power Control</h3>
Temperature: <span sd-value="ch1->last()->format('%.1f degC')">---</span>
<p>
<form>
<input type="hidden" name="form" value="power_control">
<div style="margin:10px;border:thin solid;padding:10px;width:30em">
<label><input type="checkbox" name="crate1">Crate 1</label><br>
<label><input type="checkbox" name="crate2">Crate 2</label><br>
<label><input type="checkbox" name="crate3">Crate 3</label><br>
</div>
<p>
<select name="action">
<option value="turn_on">Turn On</option>
<option value="turn_off">Turn Off</option>
</select>
<p>
<input type="submit" value="Apply" style="font-size:x-large">
</form><head> works.<form> to submit a command to the server-side
user code.<span> and <div> can have a
binding to data: use the sd-value=METRIC attribute.
<span sd-value="pressure->format('%.3e mbar')">--</span>
<input> also can have a binding to data, but the
values are updated at the initial loading and after every user
operation.
<input type="number" name="threshold" sd-value="threshold">
<input> can be enabled/disabled based on data
values: use the sd-enabled=METRIC attribute.
<input type="submit" name="start" value="Start" sd-enabled="RnuInfo['Status']->match('Idle')">
sd-value and
sd-enabled, see the Data
Transform section.image/*,
<img src="..."><iframe src="...">Current property is set, the page is
displayed only when the display time range includes “now”.<iframe src="...">[ WRITE THIS ]